Find alpha, not beta.
QSAlpha helps fill your strategy research pipeline, diversify your portfolio and improve your risk-adjusted returns for increased profitability.
QSAlpha helps fill your strategy research pipeline, diversify your portfolio and improve your risk-adjusted returns for increased profitability.
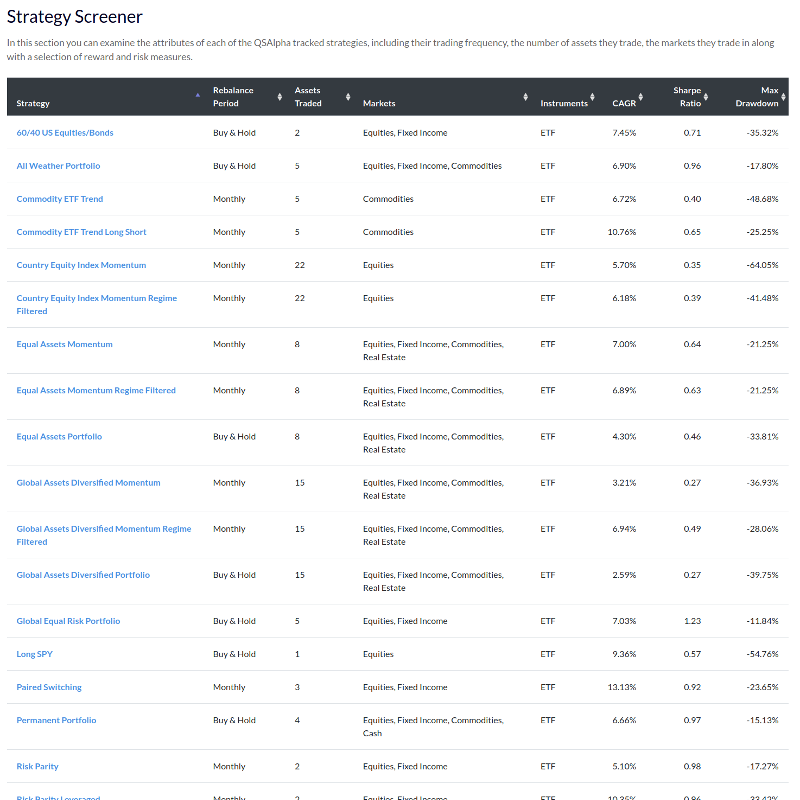
To kickstart your initial strategy research QSAlpha provides a strategy listing tool to locate strategies.
You can sort strategies based on instrument types and traded markets, including global equities, fixed income, commodities and real estate.
Strategies can be ordered based on the performance via their compound annualised growth rate (CAGR), their risk/reward characteristics via the Sharpe Ratio as well as their maximum drawdown over the backtest period.
For those looking to minimise trading costs, while still retaining good risk-adjusted performance it is possible to examine strategies based on the rebalance period and the quantity of instruments traded.
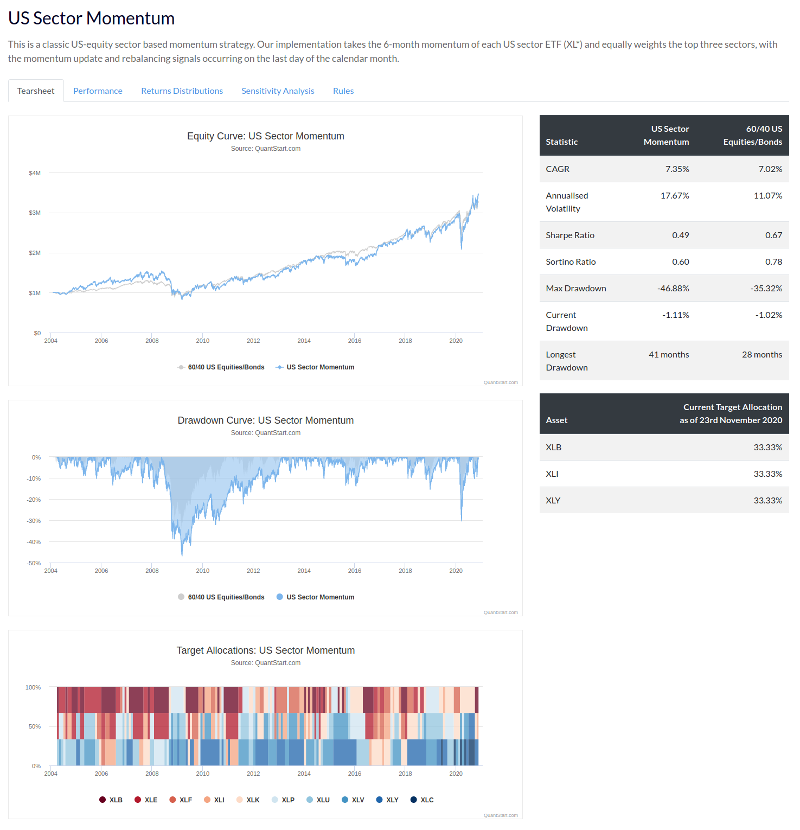
Individual strategy backtest performance can be determined at a glance with our 'tearsheet' overview.
The strategy statistics table gives you a quick overview of strategy risk and reward as compared to an appropriate benchmark. CAGR, annualised volatility, Sharpe Ratio and Sortino Ratio are provided.
Drawdown statistics include largest drawdown, longest drawdown duration as well as the current drawdown as of the previous market close.
The equity curve provides a detailed look at strategy account equity over the duration of the backtest outlining how the strategy has performed on a general basis and through crisis periods.
The drawdown 'underwater' plot helps you discover how regular—and deep—previous drawdowns have been, as well as providing insight into how long the strategy has previously taken to recover.
The historical target allocations chart shows how often a strategy has previously traded along with the various instruments it has held at any particular point in the past. Current allocations as of the previous market close are helpfully provided in the statistics section.
All charts provide zoom capability allowing you to analyse particular periods of interest for the strategy.
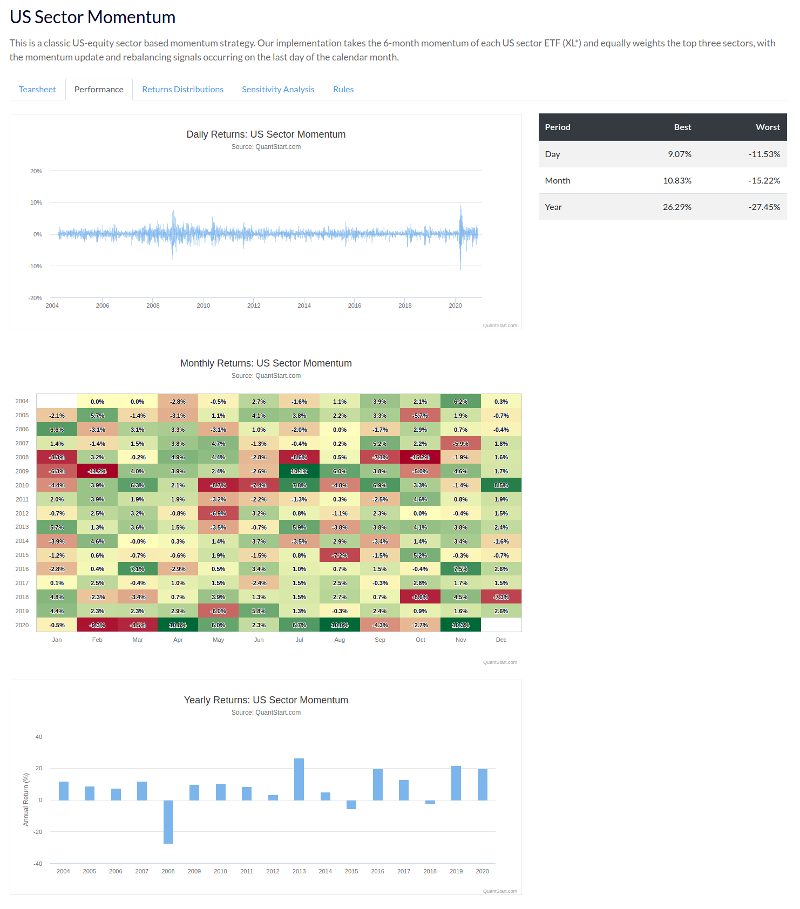
Our performance analytics provide strategy returns aggregated on various timescales to help you understand long-term strategy performance.
Daily returns aggregation through time helps you determine the best and worst days that have occurred over the lifetime of the strategy backtest, as well as how the strategy performed on 'crisis days'.
A monthly performance heatmap is calculated helping you determine the typical variation in performance on a monthly aggregated basis. This gives an indication if a strategy has performed solely because of a 'few good months' or whether it performs consistently.
A yearly aggregation gives an insight into whether the strategy has been a consistent annual performer or whether its year-to-year performance is 'lumpy'.
The statistics table displays the best and worst of all three time period aggregations at a glance, providing insight into historical performance extremes.
All charts provide zoom capability allowing you to analyse particular periods of interest for the strategy.
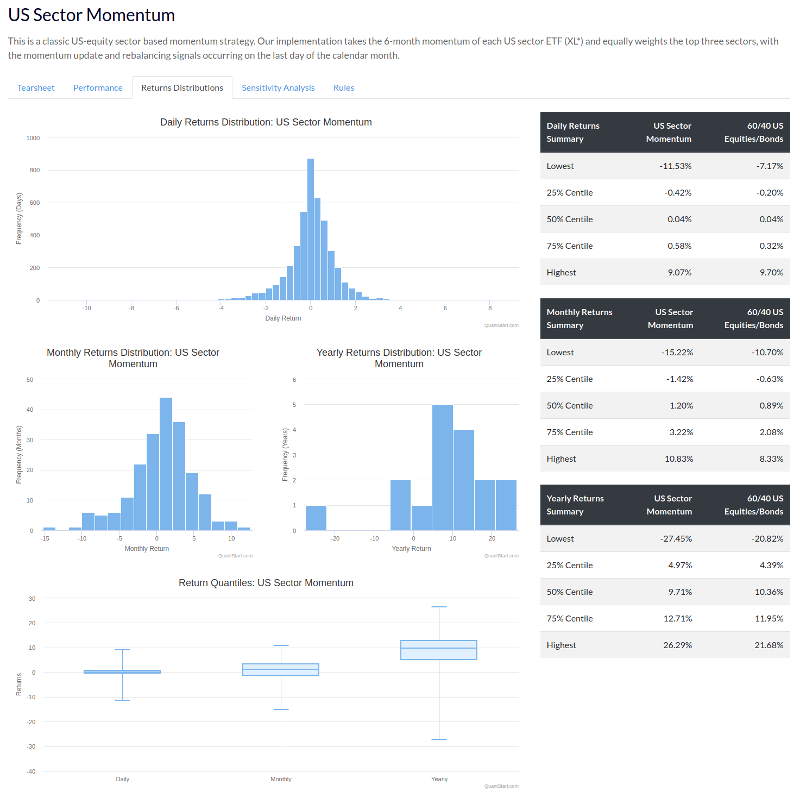
To complement the aggregated returns analytics, QSAlpha also provides statistical insight into the distributions of returns on a daily, monthly and yearly basis.
For those who want deeper analytical insight into strategy performance the returns distribution functionality provides summary statistics for various centiles of each of the aggregated returns distributions.
The daily returns chart provides an indication of the 'average' return as well as highlighting the extremes that have occurred throughout the strategy lifetime.
Monthly and yearly histograms provide an 'at the glance' view of best and worst months and what type of performance is 'likely' for a typical strategy month or year in the backtest period.
Return quantiles are visualised with a box plot approach for all three aggregation periods of returns making it straightforward to determine what previous extremes have looked like.
For all strategies backtested in the QSAlpha database we provide a comprehensive set of implementation details in order to help you replicate our results.
We provide sufficient detail on strategy implementation to allow you to utilise your own favourite backtesting tool—along with your preferred data vendors—to recreate our results and verify the historical performance.
For those looking to obtain near identical results it is possible to combine a QSAlpha membership with the usage of our freely available open source backtesting tool QSTrader. This is the same tool utilised by the QuantStart team to backtest all QSAlpha strategies internally.
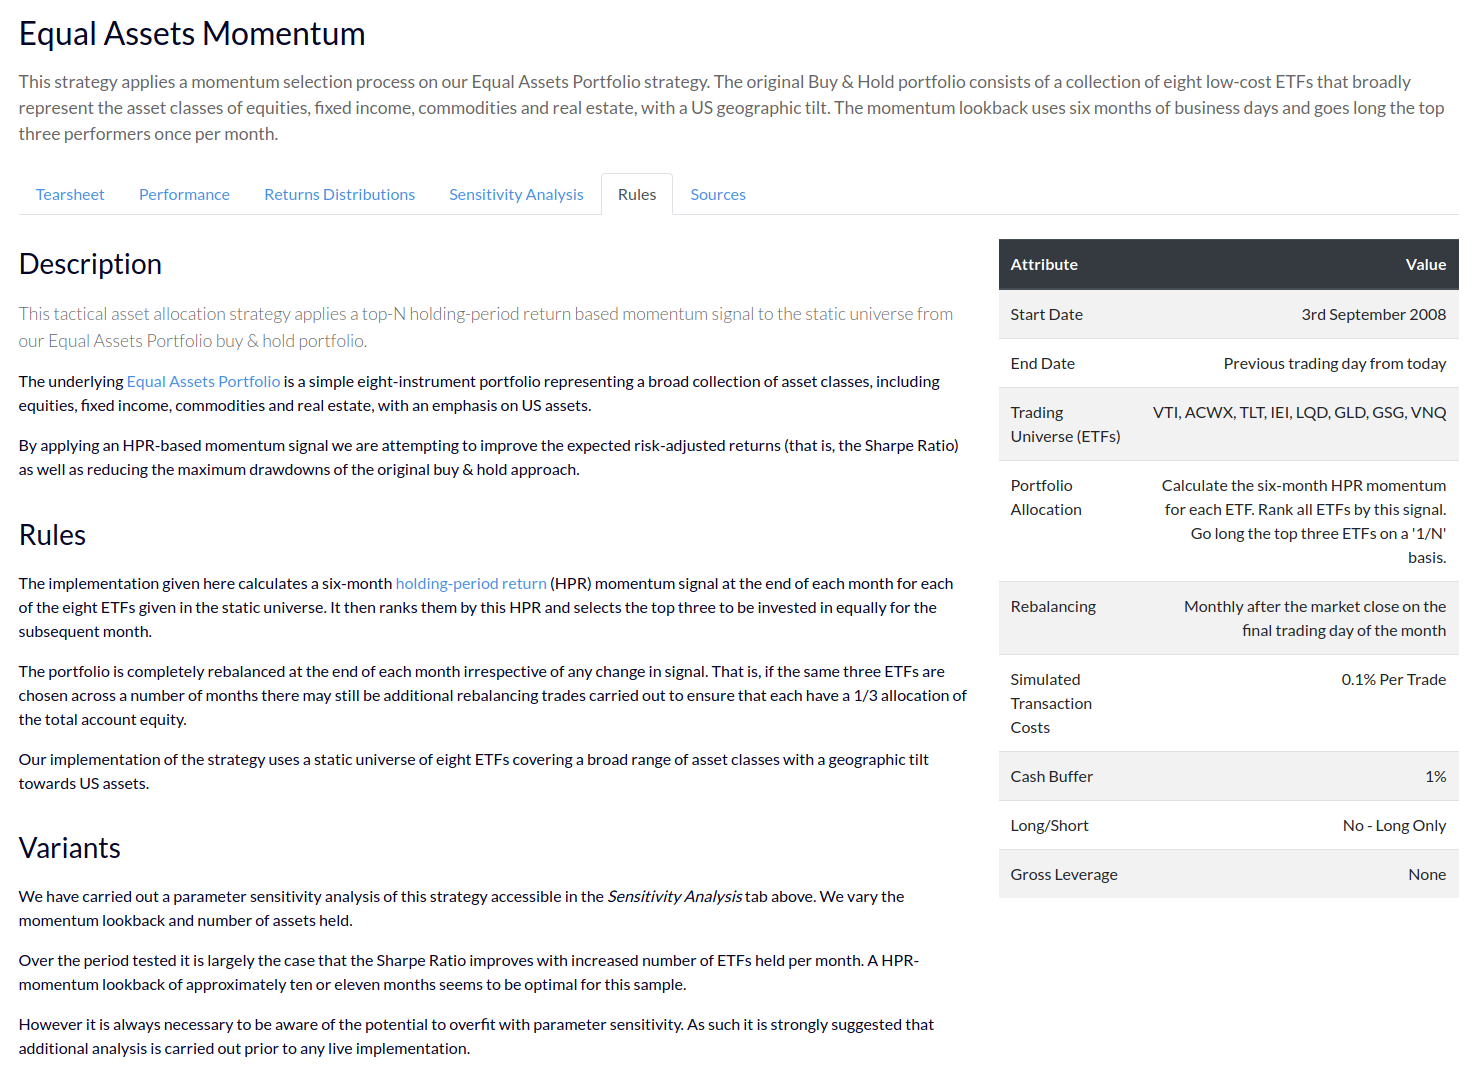
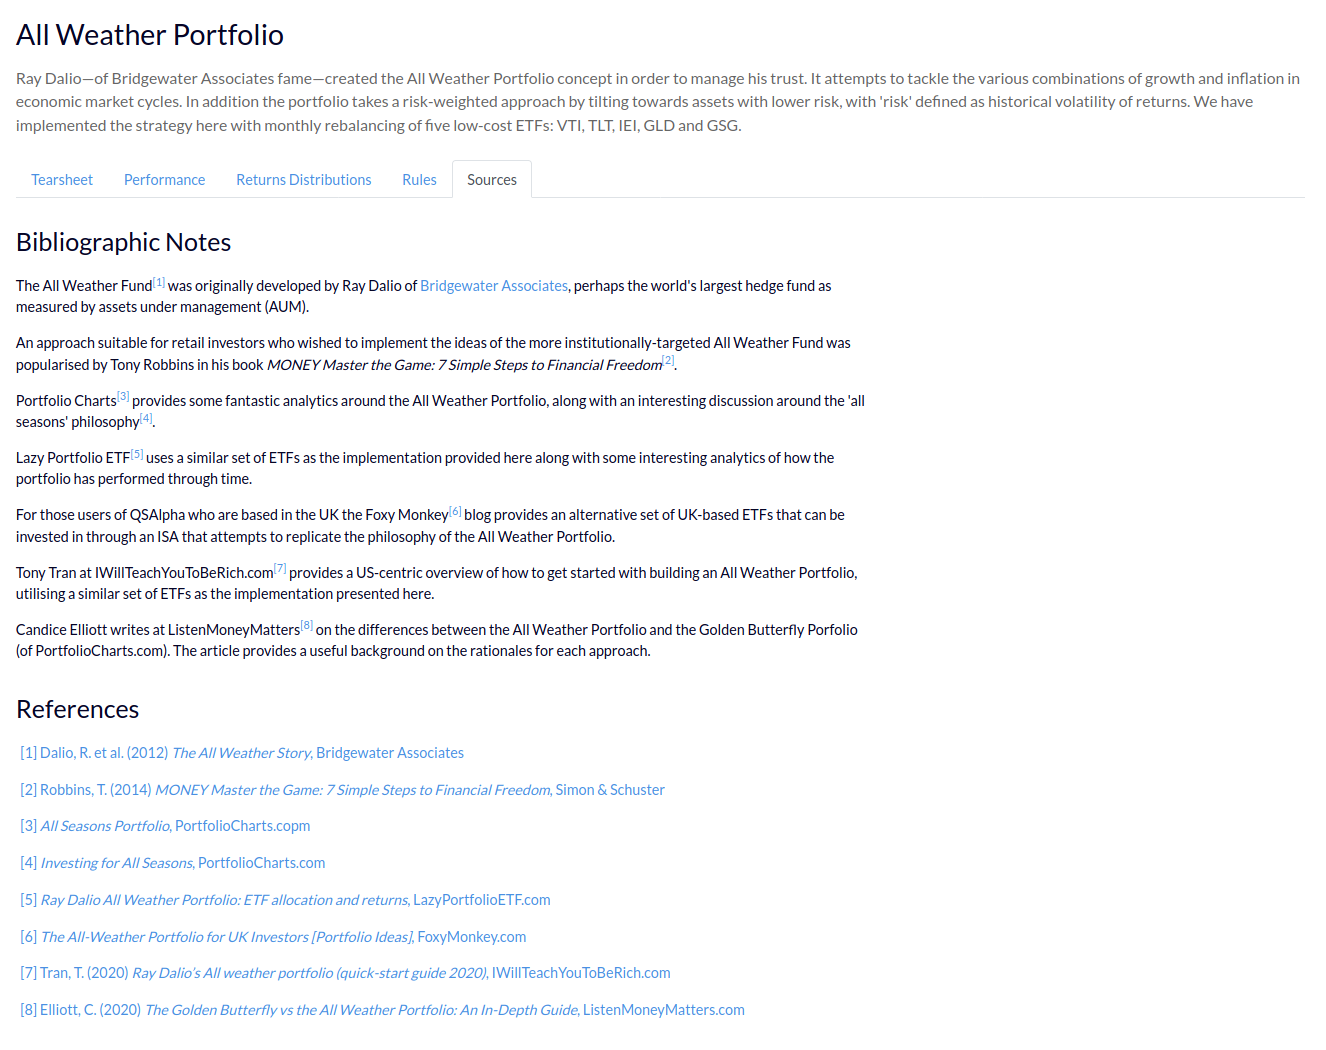
Our strategy implementations are based on publicly available academic finance references. We provide the original reference(s) as well as similar research within our 'Sources & References' section.
All of our cited sources provide a link back to the originating publisher, including academic journals, preprint servers and research networks, to help you carry out more detailed research on any individual strategy.
While our strategy implementations are usually derived from a single reference it is often the case that many other references provide identical or similar implementations. To help you further navigate variations in a strategy we also provide detailed references to similar work.
QSAlpha is a research membership portal providing up-to-date independently simulated out-of-sample backtests, with extensive performance statistics and implementation rules for the latest publicly available systematic trading strategies based on leading academic finance research.
QSAlpha is designed to help you diversify your portfolio and generate better risk-adjusted returns, without the hard work of having to continually fill the 'strategy research pipeline'.
QSAlpha removes the effort from the systematic strategy research process by providing detailed backtests, extensive analytics and implementation rules of strategies that have been shown to perform out-of-sample. The provided implementations can save weeks or months of frustrating research time, giving you time to test more strategy variations and ultimately achieve better returns.
We currently add strategies on a monthly basis after an extensive in-house research period.
Our strategies are thoroughly researched to ensure that they are simple to understand and provide good risk-adjusted and diversified performance. Hence for any strategy that we do include, we have not included many more.
We currently have 24 buy & hold (static asset allocation) portfolios and 21 monthly dynamic tactical asset allocation strategies simulated, which are continually updated out-of-sample on a daily basis.
New strategies are added after a period of in-house research on a monthly basis.
Our strategy implementations are derived from trading rules outlined in publicly available academic sources such as research networks, financial journals and pre-print servers. We do not implement or backtest proprietary strategies from non-publicly available sources.
We always provide detailed references to the original author's work for each strategy. In addition we attempt to provide references for strategies that are similar to those presented. We also provide a selection of our own custom strategy ideas that have featured on QuantStart.com in the past.
QSAlpha contains a range of strategies with varying trading frequencies.
We include a range of buy & hold portfolios, which are rebalanced on a monthly basis to keep the static proportional allocation of assets in line.
We include a range of tactical asset allocation (TAA) strategies that generate signals, and are rebalanced, on a monthly basis. Such strategies make use of well-known academic factors such as momentum, trend following and 'risk parity'.
The range of strategies provided is designed to provide diversification potential to your own portfolios, spur ideas in your own research by varying the rules provided or combining strategies in various ways and allow a selection of trading frequencies to suit your own needs.
All of our strategies are currently implemented via low-cost Exchange Traded Fund (ETF) instruments to capture exposure to a range of asset classes, including global equities, global fixed income (sovereign and corporate), commodities and real estate.
We do not utilise forex, futures or options in any of our strategies as of yet.
Most of the presented strategies do not employ leverage and are long-only. However, for educational purposes we have provided alternative versions of some strategies where we have increased leverage. Such strategies are clearly marked.
We also provide long/short portfolios for certain strategies, which inherently utilise margin in the form of borrowing stock from a simulated brokerage.
The following assumptions are made in all backtests:
Yes. All of the strategies we present are backtested out-of-sample up to the close of the previous trading day from the current day.
We utilise two benchmarks in our backtests. The first is a simple buy & hold of a broad market index ETF representing exposure to large-cap US firms. The second is a typical US 60/40 equities/bonds portfolio, rebalanced on a monthly basis, implemented via the low cost ETFs that represent broad exposure to US equities and bonds.
These benchmarks are very typical of long-term investment portfolios and are easily understood and implemented. They are also very common within the institutional quantitative hedge fund world as fund benchmarks.
All of the strategy backtests are simulated with the latest version of our own QSTrader open source backtesting engine to further increase transparency of implementation.
We use dividend and split-adjusted daily Open-High-Low-Close (OHLC) 'bar' data for all of the ETFs utilised by the trading strategies.
We do not offer trading signals from the strategy backtests. However, we do provide current indicative target percentage portfolio allocations based on the generated signals of the strategy.
No. QSAlpha is a research platform that provides out-of-sample simulated backtests only. It does not provide any capability to connect to a brokerage or carry out automated trading.
While we do not test 'custom rules', we are open to suggestions to backtest strategies that are derived from publicly available research sources, such as research networks, journals or pre-print servers.
Yes. Our payment provider Paddle allows payment via credit cards and PayPal.
We accept all major credit cards and PayPal. Our subscriptions automatically renew unless you decide to cancel. Our payments are processed by Paddle and we use TLS/SSL technology to ensure that your payment information remains secure.
We offer a 'no quibble' cancellation policy. If you are unsatisified with your membership for any reason, you can cancel your subscription at any time. You can either cancel directly through the Account section in the membership portal or email us at support@quantstart.com and we will take care of the cancellation for you.