This is the fourth in a new advanced series of posts written by Imanol Pérez, a PhD researcher in Mathematics at Oxford University and an expert guest contributor to QuantStart.
In this post Imanol applies the Theory of Rough Paths to the task of predicting which country a company belongs to based on the evolution of its stock price and traded volume.
- Mike.
As we saw in the last article, the signature of a path can be a powerful tool to tackle machine learning problems. The previous article showed an application to a toy problem, but as we will see in this article rough path theory and signatures can also be used in more practical applications.
More specifically, we will build a model that predicts, and quite accurately in fact, which country a company belongs to using the evolution of its stock price and traded volume.
Obviously, the way the price of a stock changes over time varies from company to company. If a company is profitable and investors think it will still be profitable in the future, the price of its stock will probably rise. If, on the other hand, a company is near bankruptcy it is quite likely that the price will fall.
However, intuitively it makes sense (and this is in fact what one observes in real life) to expect that outside factors that affect the country as a whole will also have an impact on the price of a stock. Therefore, it is reasonable to think that prices of stocks that trade on the same country will have some intrinsic similarities, that go beyond the performance of each particular company.
The objective of this article will be to capture these similarities using signatures. We will make use of two main ingredients for this task: the daily price of the stock over a year, and the daily volume over the same period of time. We will consider stocks of three different countries: United States, United Kingdom and Germany. As we will see, the model can correctly predict the country a stock belongs to with an accuracy of 97%.
The companies that were used can be found in this file. We shall first load the data from each company:
import pandas as pd
import pandas.io.data as web

# We will consider data from 2016.
start = datetime.datetime(2016,1,1)
end = datetime.datetime(2017,1,1)

# Load data from each company.
data=[]
for country in tickers:
    print("Loading companies from "+country+"...")
    for company in tickers[country]:
        companyData=getData(company, start, end)

        # If the company doesn't have any data, ignore it.
        if len(companyData)==0: continue

        data.append(Stock(companyData, country))
    print("Done.")
where the class Stock is given by the following:
class Stock:
    '''
    Class that contains information about a stock,
    that will later be used.
    '''

    def __init__(self, data, country):
        # Store the stream of data.
        self.data=np.array(data, dtype='float32')

        # Store the country the stock belongs to.
        self.country=country

        # Since the output to train the model must
        # be a vector, each country will be given
        # by a point, which is calculated using
        # the function country_to_point.
        self.point=country_to_point(country)


def country_to_point(country):
    '''
    Converts a country into a point
    '''
    dictionary={"US": (1,0), "UK": (-1, 0), "DE": (0,1)}
    return dictionary[country]
and the function getData is defined as follows:
def getData(ticker, start, end):
    '''
    Gets data from the specified ticker,
    for a set time period.
    '''
    stock = web.DataReader(ticker, "google", start, end)
    values=stock[["Close", "Volume"]].reset_index().values
    for i in range(len(values)):
        values[i][0]=string2datenum(str(values[i][0]),
                        "%Y-%m-%d %H:%M:%S")
    return values
Then, we divide the data into two subsets: the training set, which has 70% of the data, and the testing set, with the remaining data. The training set will be used, as the name suggests, to train the model. The testing set, on the other hand, will be useful to see how accurate our model is with out-of-sample data.
# We randomly divide the dataset into two subsets:
# the training_set, which has the 70% of the data,
# and testing_set, with the remaining 30%.
shuffle(data)
training_set=data[0:int(0.7*len(data))]
testing_set=[company for company in data
            if company not in training_set]
We may now construct the inputs and outputs that will be used to train and test the model:
# The inputs and outputs to train the model are constructed.
inputs=[company.data for company in training_set]
outputs=[company.point for company in training_set]

# Inputs and outputs to test the model are built.
inputsTEST=[company.data for company in testing_set]
outputsTEST=[company.point for company in testing_set]
Finally, we run the model for different order of signatures and test the accuracy:
# We apply the model for signature orders 1 to 4.
for signature_order in range(1, 5):
    # The model is trained.
    model=sigLearn.sigLearn(order=signature_order)
    model.train(inputs, outputs)

    # We calculate the predictions.
    predictions=model.predict(inputsTEST)

    # We check the accuracy of our predictions,
    # and print it then.
    print(accuracy(predictions, outputsTEST))
The whole code can be found in this repository.
Results
If we test the model for different signature orders, we see that the best results are obtained for the signature of order 4 (see Figure 1). In this case, the model correctly predicted which country a company belongs to with an accuracy of 97%.
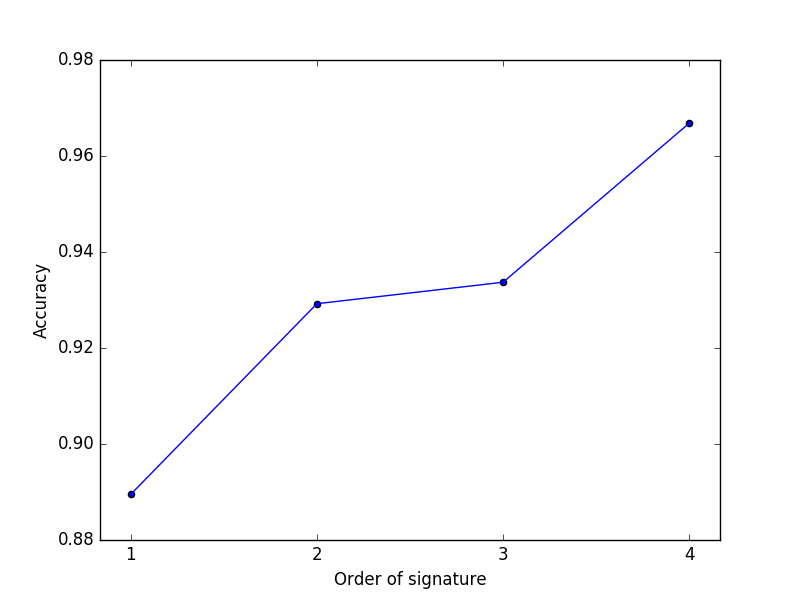
Fig 1 - Accuracy of the model
Article Series
- Rough Path Theory and Signatures Applied To Quantitative Finance - Part 1
- Rough Path Theory and Signatures Applied To Quantitative Finance - Part 2
- Rough Path Theory and Signatures Applied To Quantitative Finance - Part 3
- Rough Path Theory and Signatures Applied To Quantitative Finance - Part 4


